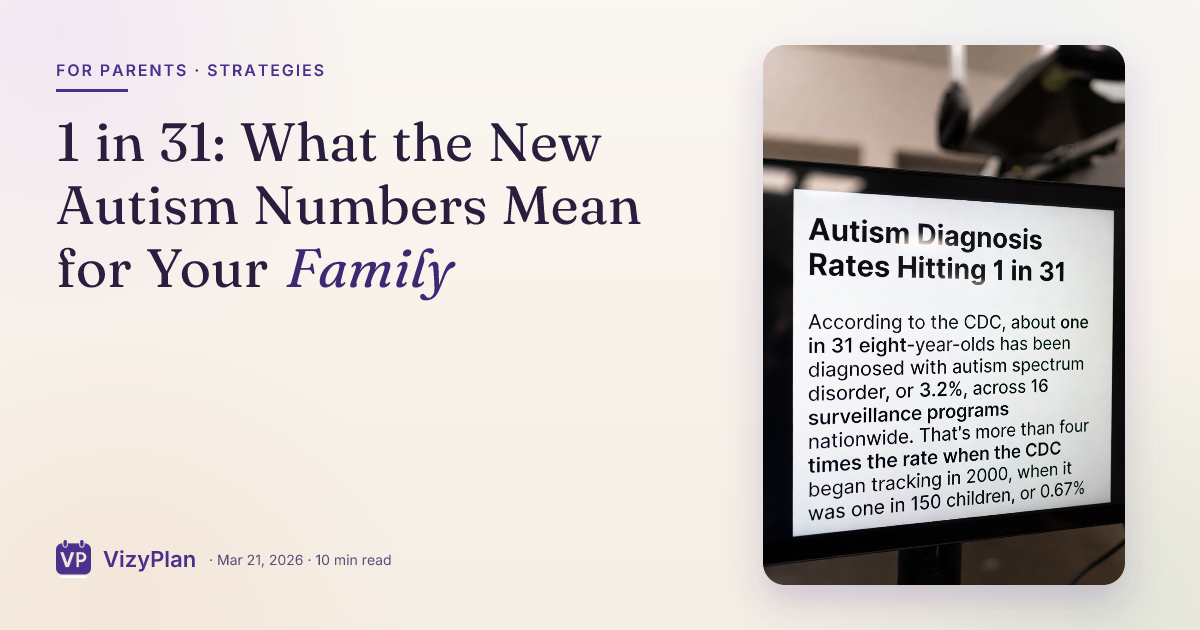
The number landed in April 2025 and it has been circulating ever since. One in 31. According to the CDC's Autism and Developmental Disabilities Monitoring Network, 1 in 31 eight-year-old children in the United States is now identified with autism spectrum disorder. That is 3.2 percent of all children in this age group, up from 1 in 36 just two years earlier.
If your child is one of them, or if you are waiting on an evaluation and wondering whether the wait will ever end, this number is not abstract. It is your morning. It is your IEP meeting. It is the therapist waitlist you have been on for months. Let us talk about what these numbers actually mean for families living this every day.
How We Got from 1 in 150 to 1 in 31
When the CDC began tracking autism prevalence in 2000, the rate was 1 in 150. In 2010 it was 1 in 68. By 2018 it had climbed to 1 in 44. Two years ago it was 1 in 36. Now it is 1 in 31. The current rate is 4.8 times higher than when surveillance began 22 years ago.
These numbers come from the ADDM Network, which reviewed medical and educational records of eight-year-old children across 16 sites in 14 states plus Puerto Rico. This is not a parent survey or a physician estimate. It is a records-based surveillance system, and the 2022 report is the largest the CDC has ever published.
The question everyone asks is the obvious one: are more children actually autistic, or are we just better at finding them?
Why the Numbers Keep Rising
The honest answer is that both factors are at work, but detection accounts for the majority of the increase.
Screening has improved dramatically. Pediatricians now routinely screen for autism at 18 and 24 months. Programs like California's "Get SET Early" model trained hundreds of doctors to identify and refer children earlier. California now has the highest identified prevalence in the country at 1 in 19, not because California has more autistic children, but because California finds them.
Diagnostic criteria are broader. When the DSM-5 was published in 2013, it consolidated Asperger's Syndrome, PDD-NOS, and classic autism into a single Autism Spectrum Disorder diagnosis. Children who previously fell into separate categories or received no diagnosis at all now appear under one umbrella.
Awareness has reduced stigma. Parents are more willing to seek evaluations. Teachers are more likely to recognize signs. The cultural conversation around neurodivergence has shifted enough that families pursue answers instead of waiting and hoping.
Underserved communities are finally being reached. For the first time in the history of the ADDM Network, non-white children are identified at higher rates than white children. Black children are now diagnosed at a rate of 1 in 27. Asian and Pacific Islander children at 1 in 26. This is not because autism suddenly became more common in these communities. It reflects the closing of a diagnostic gap that left generations of children without the support they needed.
Dr. Zachary Warren, lead author of the MMWR report and executive director of Vanderbilt Kennedy Center's TRIAD program, put it this way: "The most striking piece of this is how unbelievably common presentations of autism are."
Dr. Alex Kolevzon, director of Mount Sinai's Seaver Autism Center, offered important perspective: "Parents should not panic. We are not seeing an epidemic with autism."
The Autism Society of America was direct: "This rise in prevalence does not signal an 'epidemic.' It reflects diagnostic progress."
The Gender Gap Is Still Wide
Boys are diagnosed at a rate of 1 in 20. Girls at 1 in 70. That 3.4-to-1 ratio has held relatively steady across years of data, but researchers widely agree that girls are still significantly underdiagnosed.
Girls with autism are more likely to mask their symptoms, mimicking social behavior they observe in peers and camouflaging their struggles until the cognitive and emotional cost becomes unsustainable. Many girls do not receive a diagnosis until adolescence or adulthood, long after the window for early intervention has closed.
If you have a daughter who seems to be struggling socially but "holds it together" at school and falls apart at home, the new prevalence data reinforces what many parents already suspect: the signs in girls look different, and the diagnostic system has not fully caught up.
Where You Live Changes Everything
The geographic variation in the CDC data is staggering. A 5.5 times difference separates the highest and lowest sites.
California identifies autism at a rate of 1 in 19. Texas (Laredo) identifies it at 1 in 103. The same child who would receive a diagnosis, services, and school support in one state might go entirely unidentified in another.
The CDC was clear about what drives this gap: "Differences in ASD prevalence are likely due to differences in evaluation and testing practices." It is not that some states have more autistic children. It is that some states are looking and others are not.
This matters enormously for families. If you live in a state with lower identification rates, the burden of advocacy falls harder on you. Knowing the national data gives you evidence to push for evaluations, services, and accommodations that your local system might not be offering proactively.
The Service Gap That Keeps Getting Wider
Here is where the story stops being about statistics and starts being about daily life.
The average wait from a parent's first concern to a completed autism evaluation is three years. Sixty-one percent of diagnostic centers have wait times longer than four months. Fifteen percent have waits over a year or have closed their waitlists entirely.
Once you have a diagnosis, the waiting continues. Seventy-five percent of caregivers report spending time on a waitlist for ABA therapy, with an average wait of 5.7 months. Out-of-pocket ABA costs run $150 to $200 per hour without insurance coverage.
Meanwhile, schools are absorbing the impact. In the 2022-23 school year, 7.5 million students received special education services under IDEA, and autism alone accounted for 40 percent of the total increase in special education enrollment. Schools are scrambling for speech therapists, occupational therapists, and behavior specialists who are in desperately short supply.
Sixty-nine percent of specialists cite workforce shortages as the primary barrier to timely evaluations. The children are being identified. The systems built to serve them have not kept pace.
Enjoying this article?
Get practical tips and insights delivered to your inbox — no spam, ever.
What This Means for Your Child Right Now
If your child has already been diagnosed, these numbers validate what you have been living. The classroom is more crowded with need. The therapist has a longer waitlist. The school district is stretched thinner. None of that is your fault, and none of it reduces your child's right to appropriate services.
If you are waiting for an evaluation, do not let the wait be idle time. Early intervention produces the strongest outcomes when it begins before age three, during a period of heightened brain plasticity. Research shows early intensive behavioral interventions are associated with IQ gains of 9 to 15 points and significant language improvements.
Here is what you can do while you wait.
Document everything. Keep a log of behaviors, milestones, and concerns. This becomes valuable evidence at the evaluation and at future IEP meetings. Track emotional and behavioral patterns so you walk in with data, not just observations.
Start building visual structure at home. You do not need a diagnosis to begin using visual schedules, first-then boards, and social stories. These evidence-based strategies help all children, and they are especially effective for children who struggle with transitions, routines, and emotional regulation.
Learn your rights. Under IDEA, children suspected of having a disability are entitled to evaluation by the school district regardless of whether they have a medical diagnosis. You do not have to wait for a clinical evaluation to request a school-based assessment. A 504 plan or IEP can begin while you are still on the diagnostic waitlist.
Explore funding and programs. Medicaid's EPSDT program, SSI, state grants, and insurance mandates exist in all 50 states. Many families leave thousands of dollars on the table because they do not know what is available.
Find the right therapist. Not every provider is the right fit. Ask about their experience, approach, and whether they work collaboratively with families. The relationship matters as much as the credential.
The Diagnostic Disparity That Still Exists
The median age of autism diagnosis is 47 months, just under four years old. Only half of children are diagnosed by age three. That means half of all autistic children are missing the most critical window for early intervention.
The disparities are not random. Higher-income families are significantly more likely to receive early intervention before age two. Lower-income families face additional barriers navigating complex systems with fewer resources and less flexibility.
Children from non-white families, despite now being identified at higher rates overall, are still disproportionately diagnosed only when co-occurring intellectual disability is present. Black children diagnosed with ASD have a 78.9 percent rate of co-occurring intellectual disability or borderline scores, compared to 55.6 percent for white children. This suggests that non-white children with ASD who do not have intellectual disability are still being missed.
The numbers are improving. But "improving" and "equitable" are not the same thing.
What These Numbers Do Not Mean
These numbers do not mean your child's autism was caused by something you did. Research consistently shows that up to 90 percent of autism is linked to genetic traits, with hundreds if not thousands of neurogenetic factors at play.
They do not mean that autism is a disease that needs to be cured or prevented. The Autism Society of America stated clearly: "Claiming that Autism is 'preventable' is not science based, and places unnecessary blame on people, parents, and families."
And they do not mean that your child's future is determined by a statistic. Prevalence data tells us how many children are identified. It says nothing about who those children will become, what they will accomplish, or how much joy they will bring to the people around them.
What These Numbers Do Mean
They mean your child is not rare. They mean the family sitting next to you in the waiting room is not unusual. They mean that one in every classroom of 31 children is navigating the same invisible challenges your child faces every day.
They mean we need more therapists, more funding, shorter waitlists, and school systems that are resourced to meet the actual demand. They mean that early screening works, that reaching underserved communities matters, and that every child deserves a path to diagnosis and support regardless of zip code or income.
And for you, right now, sitting in a kitchen that still has this morning's breakfast battle on the table and tonight's bedtime routine already on your mind, they mean one thing above all: you are not alone. Not even close.
Download VizyPlan and start your 7-day free trial today. Build visual schedules that bring structure to your child's day while you wait for services, use first-then boards to reduce transition meltdowns, track emotional and behavioral patterns to bring real data to evaluations and IEP meetings, and create social stories that prepare your child for new experiences. Just $6.99/month after your trial, no credit card required upfront.